HMDA Maps
Maps Tool: https://ffiec.cfpb.gov/data-browser/maps/
Overview
HMDA Maps provides a way to visually analyze population-density adjusted, geographic distributions for subsets of HMDA Data. It enables side-by-side comparison of aggregated statistics for up to two popular variables. Once you have found your desired data, you can download the raw data as CSV, copy and share the page url, or save the summary report as a PDF.
What does each option mean?
| Definition | Screenshot |
|---|---|
| YEAR: The year in which the loan was processed. |  |
| MAP LEVEL: The geographic level at which the HMDA Data is aggregated. |  |
| WHERE & AND: These filters allow you to narrow the selected data based on popular variables. | 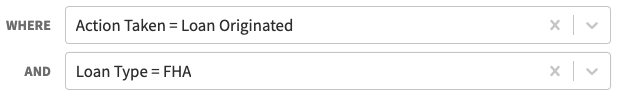 |
What does the map show?
The map displays the concentration of loans that match your selected filters, adjusted for population density, across the selected Geography (State or County). Darker colors indicate a higher occurrence rate in that region, while lighter colors indicate a lower occurrence rate.
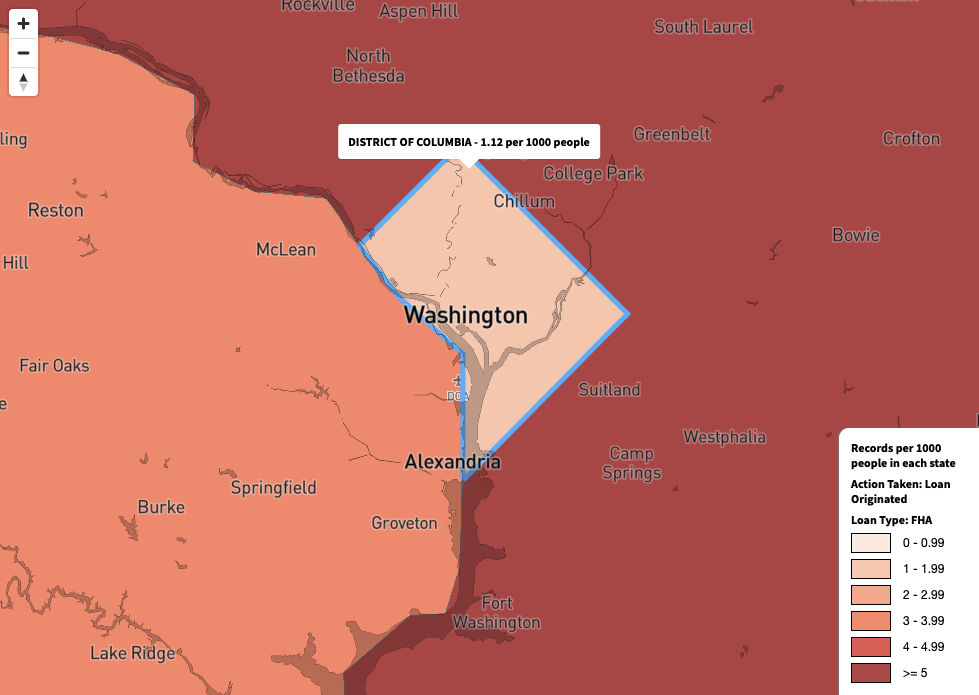
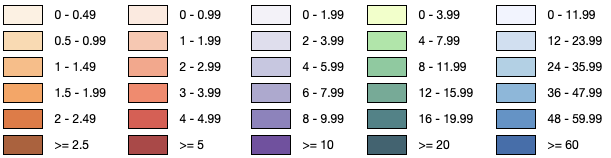
The various color palettes (orange, red, purple, green, blue) are used to highlight the fact that the application uses different "bucketing" algorithms in order to display a useful level of color variation on the map, and are not indicative of any interpretation about the outcomes presented.
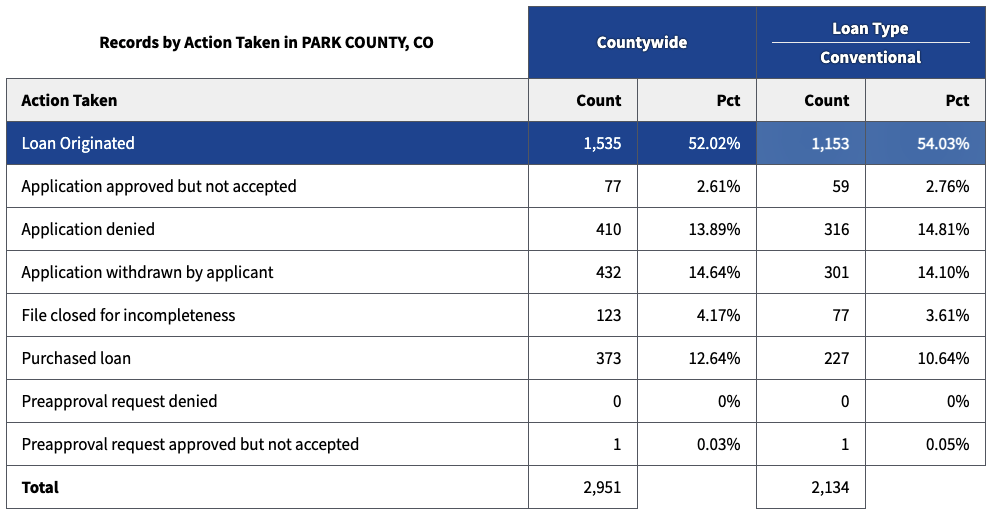
What do the data tables show?
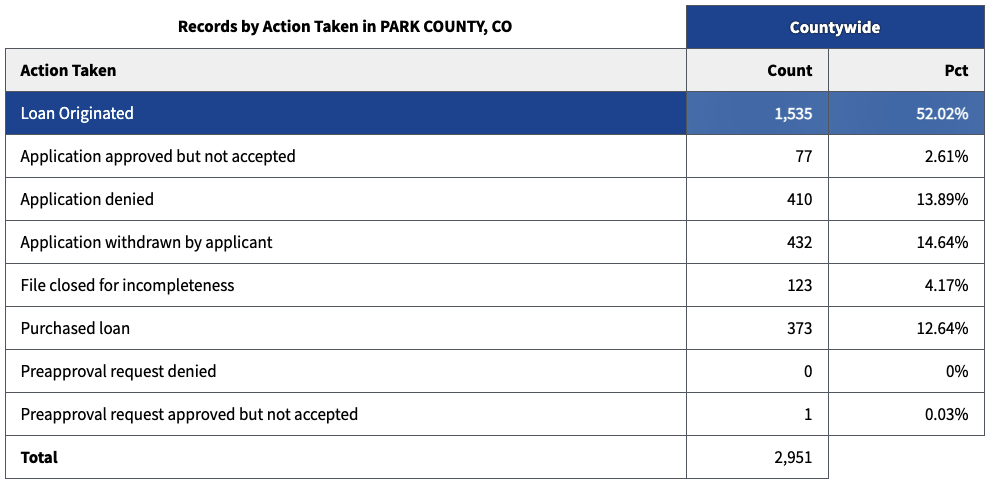
The data tables show the aggregated data for the selected filter variables.
- When only one filter is selected, you will be presented with a single table that includes a row for each option of the filter.
- When two filters are selected, another table will be displayed for the second filter's data. Additionally, a new set of columns will be included in each table to highlight the intersection between the selected filters.
| One Filter | Two Filters |
|---|---|
 |  |
How can I save and share my map?
Share the URL
The URL will take the visitor directly to the map, and zoom to the selected geography. Users can then print the report, or continue to explore HMDA Data using your selections as a starting point.
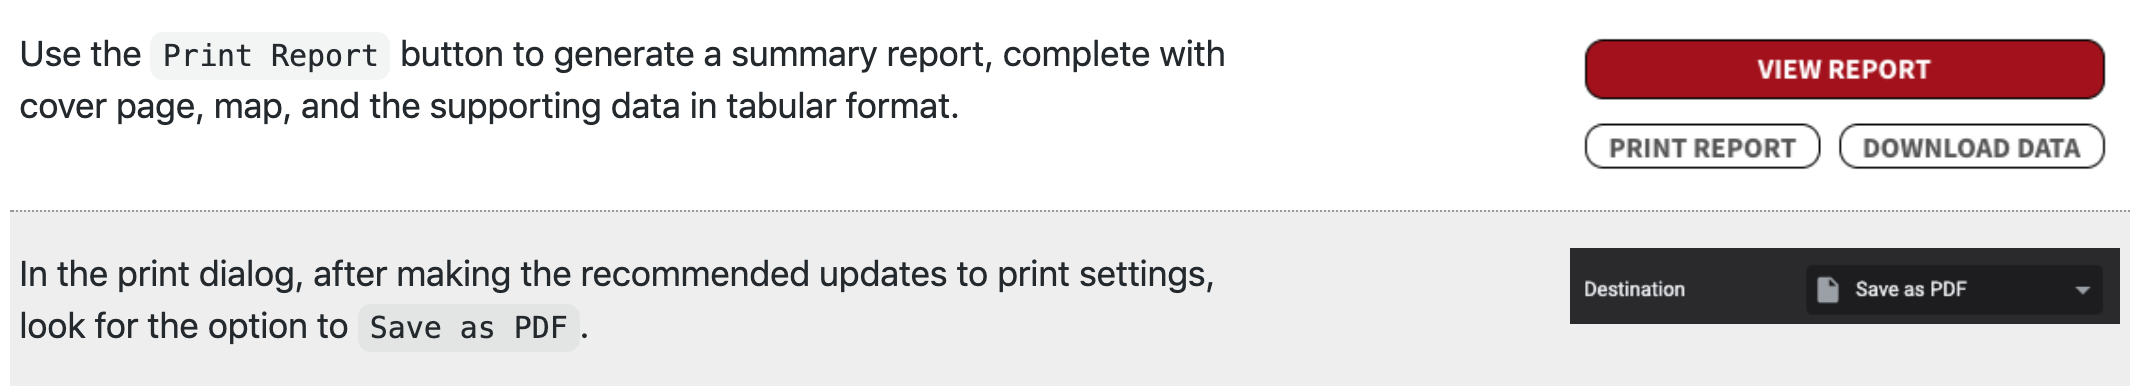
Save as PDF
How can I download the raw data used to generate my report?

How do I interact with the map?
| Function | Mouse | Keyboard | Touchpad |
|---|---|---|---|
- Zoom In - Zoom Out - Orient North |  | +-Tab to highlight the Orient North icon, then press Enter | - pinch/scroll- pinch/scroll- Click Orient button |
- Select a region | Click on map | None? | Click on map |
- Rotate the map |  | None? | Right-click and drag on map |
- Pan the map | Left-click and drag | Arrow keys | Left-click and drag |
- Reset the view | Reload the page | Reload the page | Reload the page |
Report a bug
- Please open an Issue that includes a detailed description of the issue you're experiencing, along with the URL.
- If you are not familiar with using GitHub Issues, you can email hmdahelp@cfpb.gov with a description of the bug or issue.