HMDA Quarterly Graphs
Graphs Tool: https://ffiec.cfpb.gov/data-browser/graphs/quarterly/
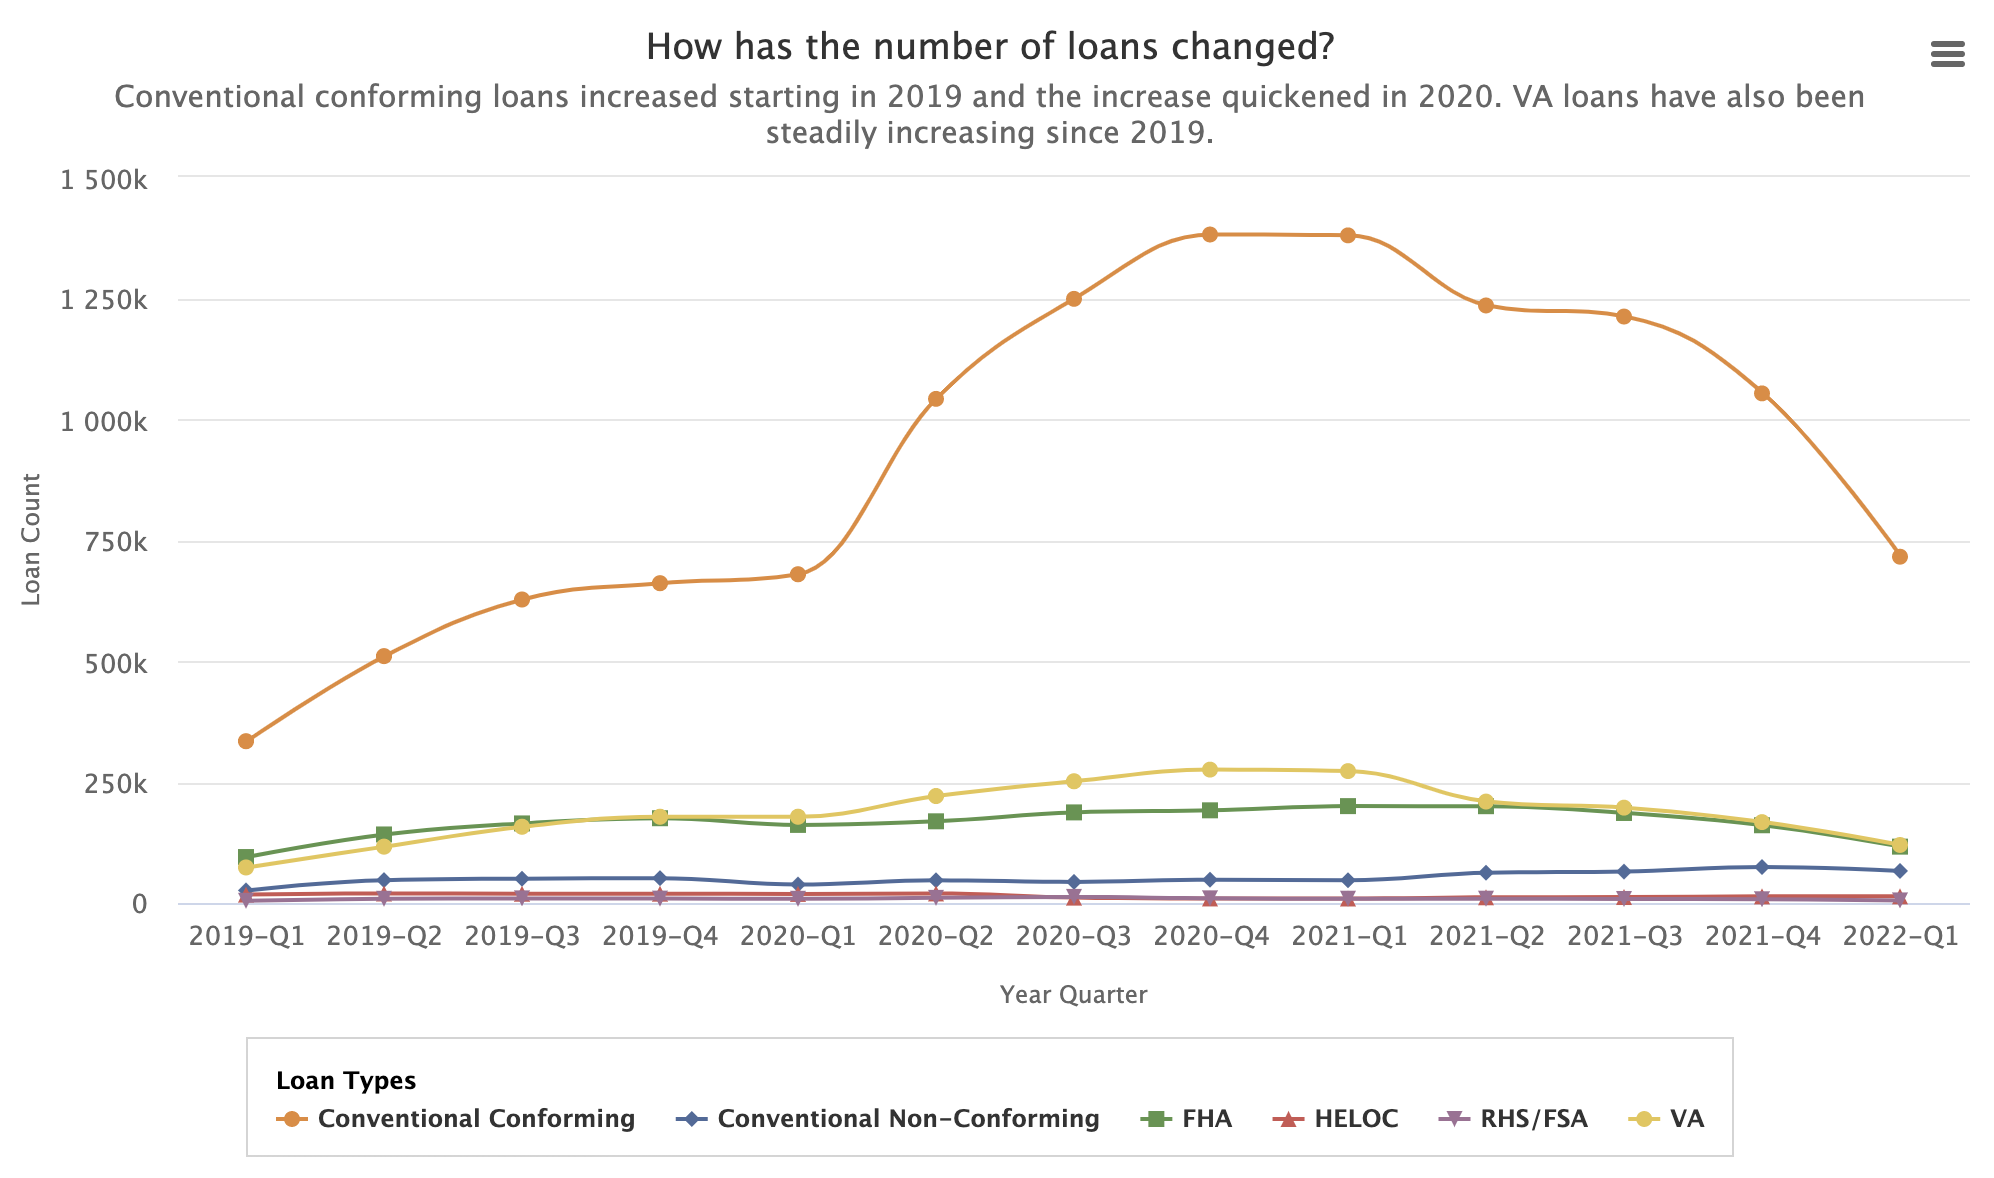
What do the Quarterly Graphs display?
The Quarterly Graphs display an aggregated view of quarterly filers for the current filing year.
What are the requirements to become a quarterly filer?
A financial institution is required to report quarterly HMDA data if it reported a combined total of at least 60,000 applications and covered loans, excluding purchased covered loans, for the preceding calendar year. Institutions file quarterly data three times a year, with quarter four data being reported in the following year’s annual submission.
What institutions are displayed in the Quarterly Graphs?
The institutions displayed are those required to file quarterly data in the current year. The requirement to file quarterly data is determined using an institution's annual submission for the preceding year. The list of institutions, as well as the aggregate record data, represented on the Quarterly Graphs is limited to those that are designated as quarterly filers for the current calendar year. This means that historic data are altered to reflect only the data related to current quarterly filers. Please note that this may cause changes to historic data, meaning they are not static.
How do I view a list of quarterly filers?
View a list of quarterly filers by navigating to the “Filer Info” tab.
Users can view the filer name, legal entity identifier (LEI), regulatory agency, and loan/application register (LAR) counts for the previous three years.
How can I sort the quarterly filer list?
By default, the quarterly filer list is sorted alphabetically by Agency and Institution, respectively. The sort order is reflected in the direction of the arrow adjacent to the field name. An up arrow indicates an ascending sort (e.g. A to Z, least to highest) and a down arrow indicates the opposite (e.g. Z to A, highest to least).
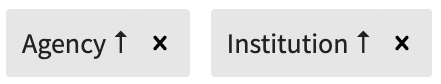
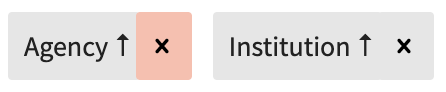
You can remove any of the applied sort criteria by clicking the x icon within the corresponding label.
Sort direction is controlled by selecting the column header of a field. A double-sided arrow indicates that a column is not currently sorted.

To change the primary sort criteria:
- Remove any secondary sort criteria by selecting the associated
xof the sort labels - In the quarterly filer table, select the column header of the field you wish to sort by
- Click the column header again to change the sort direction
To change the sort direction of an already applied sort criteria:
- Select on the column header of the field
- Observe that the arrow icon adjusts to reflect the newly reversed sort direction
To add additional sort criteria:
- Hold the shift key and select the desired column headers
- Observe that the sort criteria shown above the data table reflect the order in which sort criteria are applied
How are loans sorted into quarters?
Loans are grouped by quarter based on their Final Action Taken date.

Quarterly Filing - Action Taken Dates
- Quarter 1: January 1 - March 31
- Quarter 2: April 1 - June 30
- Quarter 3: July 1 - September 30
- Quarter 4: October 1 - December 31
What categories of graphs can I choose from?
You can select from 21 graphs that cover the following categories:
- Combined loan-to-value ratio
- Credit score
- Debt-to-income ratio
- Denial rates
- Interest rates
- Loan & application counts
- Total loan costs
How do I view data from a specific quarter(s)?
Select your desired range from the “Filing Period Range” drop down. You can choose from any quarter in the past three years up until the latest quarter of data published.
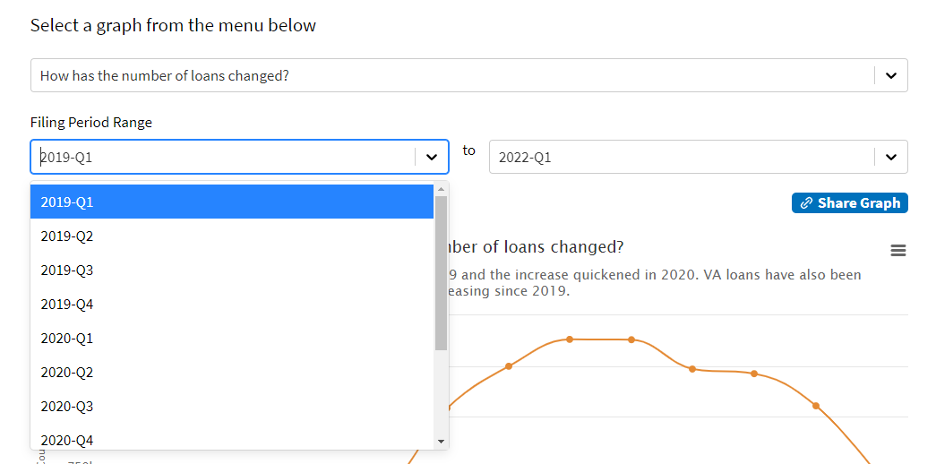
To return to viewing all the available quarters, select “Show All Quarters”.
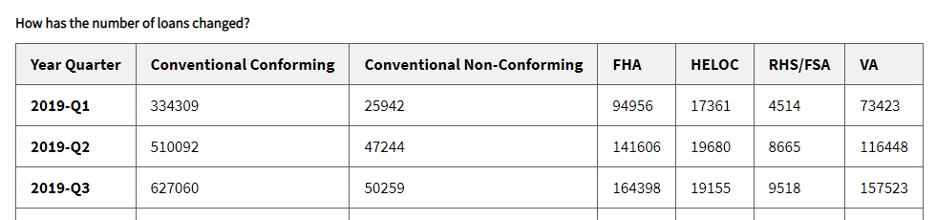
How do I remove or add specific lines on the graph?
You can customize which lines are shown on the graph by selecting within the legend.
For example, selecting ‘Conventional Conforming’ and ‘Conventional Non-Conforming' will deactivate those lines on the graph and only display the other four options (FHA, HELOC, RHS/FSA, & VA). When a line is deactivated, its name in the legend will turn gray and the line will disappear from the graph display.
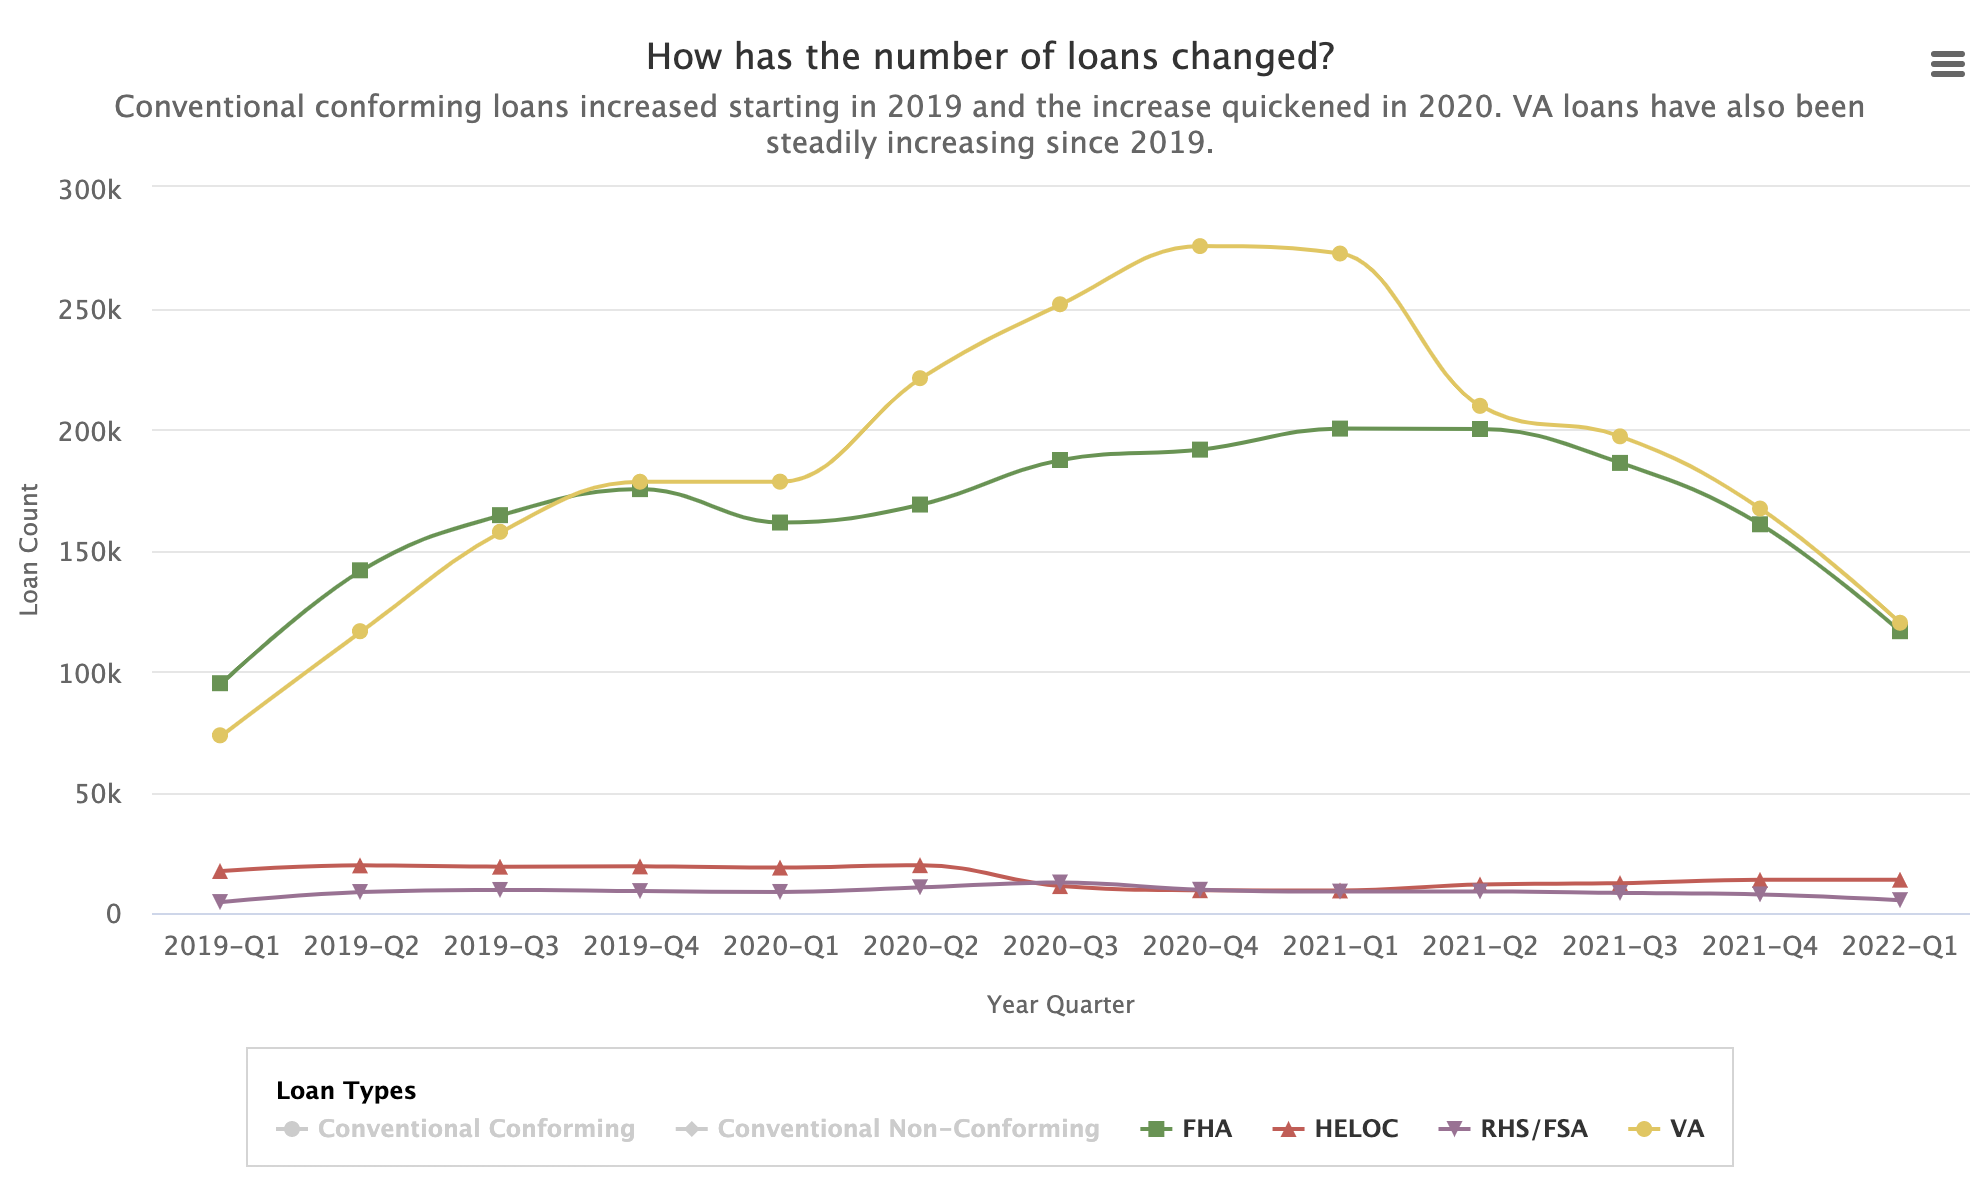
To reactivate the deactivated lines, select them and they will be re-displayed on the graph.
Removing series lines will also update the columns in the table that is displayed below the graph.
How can I share a specific graph?
Selecting “Share Graph” on the top right of the graph will copy a link to the graph you are currently viewing. The link will preserve your selections for the Filing Period Range filters and the series lines that are currently displayed. You can then paste the link to your desired location.

How can I download a screenshot of the graph I am viewing?
Select the three horizontal lines on the top right of the graph to display a list of options. You can download an image of the graph by using any of the four options indicated below. You can choose between a PNG, JPEG, PDF, or SVG file formats.
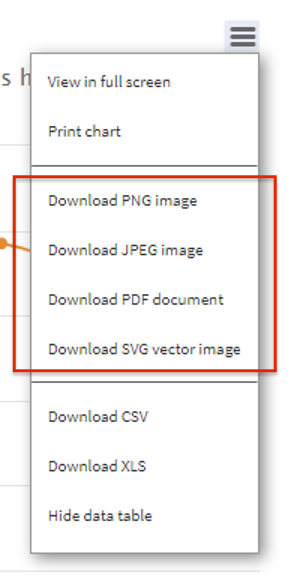
Selecting one of the options will download the file to your computer.
How can I download the data that the graph is displaying?
Select the three horizontal lines on the top right of the graph to display a list of options. You can download the data displayed in either a CSV or XLS format.
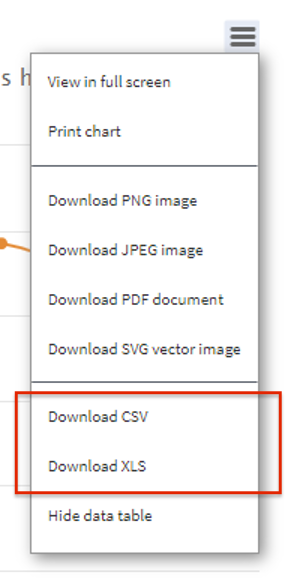
The data that will be in the CSV or XLS is the same data that is displayed in the table below the graph.
Can I review the underlying loan level quarterly data?
To protect borrow privacy, the underlying loan and institution level data is not displayed. When the annual data for the institutions are released the following year, the data will be disclosed in accordance with the Data Disclosure Policy.
Learn more about the different loan types
-
Conventional Conforming: Conventional Conforming have maximum loan amounts that are set by the government.
-
Conventional Non-Conforming: Non-conforming loans are less standardized. Eligibility, pricing, and features can vary widely by lender, so it’s particularly important to shop around and compare several offers.
-
Federal Housing Administration (FHA): FHA are loans from private lenders that are regulated. The FHA doesn’t lend the money directly–private lenders do.
-
Home Equity Line of Credit (HELOC): A home equity line of credit (HELOC) is an “open-end” line of credit that allows you to borrow repeatedly against your home equity.
-
Rural Housing Service (RHS): RHS offers mortgage programs that can help low- to moderate-income rural residents purchase, construct, and repair homes.
-
Farm Service Agency (FSA): FSA are loans to help farmers and ranchers get the financing they need to start, expand or maintain a family farm.
-
Veterans Affairs (VA): VA offers loan programs to help servicemembers, veterans, and their families buy homes.
How often will the quarterly graphs be updated?
The graphs are updated with the latest data at the conclusion of each quarterly filing period, including the late submission period. A calendar of quarterly filing periods can be found in the Quarterly Filing documentation.
Additional questions or feedback can be sent to hmdahelp@cfpb.gov.